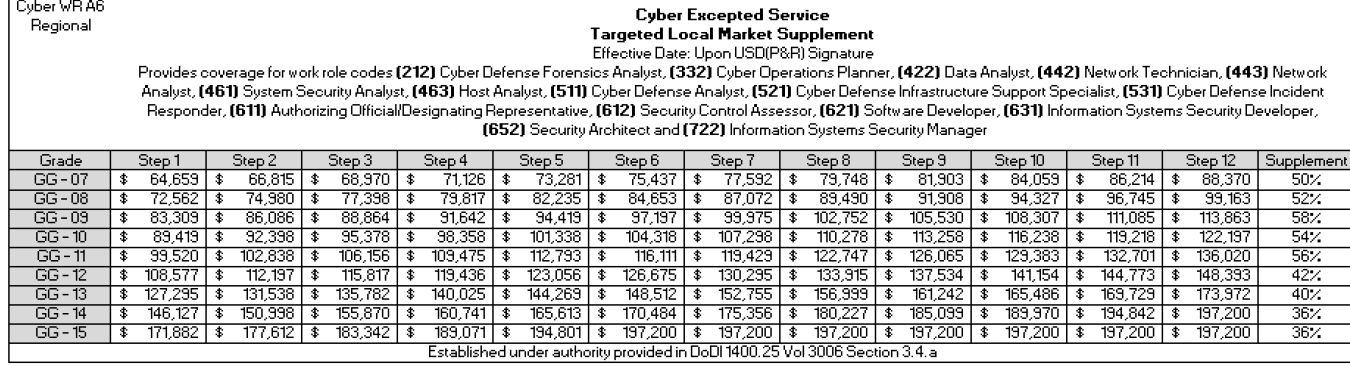
Effective the first day of the first applicable pay period beginning on or after January 1, 2026
AUTHORITY: CES grade rate ranges are authorized in accordance with DoDI 1400.25, Volume 3006, “DoD Civilian Personnel Management System: Cyber Excepted Service (CES) Compensation Administration,” August 15, 2017. *The extended range is available to employees through appointments, promotions, and awards recognition as set forth in DoDI 1400.25, Volume 3006. The extended range is not accessible through longevity-based-within-grade-increases.
2026 Department of War
Cyber Excepted Service (CES) Personnel System
Local Market Supplement (LMS) Rates
Locality Market Supplement payment percentages by locality pay area for the 2026 Cyber Excepted Service Personnel System.
| Locality Pay Area |
Locality Payment |
| Alaska |
32.36% |
| Albany-Schenectady, NY-MA |
20.77% |
| Albuquerque-Santa Fe-Las Vegas, NM |
18.33% |
| Atlanta--Athens-Clarke County--Sandy Springs, GA-AL |
23.79% |
| Austin-Round Rock-Georgetown, TX |
20.35% |
| Birmingham-Hoover-Talladega, AL |
18.24% |
| Boston-Worcester-Providence, MA-RI-NH-CT-ME-VT |
32.58% |
| Buffalo-Cheektowaga-Olean, NY |
22.41% |
| Burlington-South Burlington-Barre, VT |
19.45% |
| Charlotte-Concord, NC-SC |
19.67% |
| Chicago-Naperville, IL-IN-WI |
30.86% |
| Cincinnati-Wilmington-Maysville, OH-KY-IN |
21.93% |
| Cleveland-Akron-Canton, OH-PA |
22.23% |
| Colorado Springs, CO |
20.15% |
| Columbus-Marion-Zanesville, OH |
22.15% |
| Corpus Christi-Kingsville-Alice, TX |
17.63% |
| Dallas-Fort Worth, TX-OK |
27.26% |
| Davenport-Moline, IA-IL |
18.93% |
| Dayton-Springfield-Kettering, OH |
21.42% |
| Denver-Aurora, CO |
30.52% |
| Des Moines-Ames-West Des Moines, IA |
18.01% |
| Detroit-Warren-Ann Arbor, MI |
29.12% |
| Fresno-Madera-Hanford, CA |
17.65% |
| Harrisburg-Lebanon, PA |
19.43% |
| Hartford-West Hartford, CT-MA |
32.08% |
| Hawaii |
22.21% |
| Houston-The Woodlands, TX |
35.00% |
| Huntsville-Decatur, AL-TN |
21.91% |
| Indianapolis-Carmel-Muncie, IN |
18.15% |
| Kansas City-Overland Park-Kansas City, MO-KS |
18.97% |
| Laredo, TX |
21.59% |
| Las Vegas-Henderson, NV-AZ |
19.57% |
| Los Angeles-Long Beach, CA |
36.47% |
| Miami-Port St. Lucie-Fort Lauderdale, FL |
24.67% |
| Milwaukee-Racine-Waukesha, WI |
22.42% |
| Minneapolis-St. Paul, MN-WI |
27.62% |
| New York-Newark, NY-NJ-CT-PA |
37.95% |
| Omaha-Council Bluffs-Fremont, NE-IA |
18.23% |
| Palm Bay-Melbourne-Titusville, FL |
17.93% |
| Philadelphia-Reading-Camden, PA-NJ-DE-MD |
28.99% |
| Phoenix-Mesa, AZ |
22.45% |
| Pittsburgh-New Castle-Weirton, PA-OH-WV |
21.03% |
| Portland-Vancouver-Salem, OR-WA |
26.13% |
| Raleigh-Durham-Cary, NC |
22.24% |
| Reno-Fernley, NV |
17.52% |
| Rest of US (Including Territories and Possessions) |
17.06% |
| Richmond, VA |
22.28% |
| Rochester-Batavia-Seneca Falls, NY |
17.88% |
| Sacramento-Roseville, CA-NV |
29.76% |
| San Antonio-New Braunfels-Pearsall, TX |
18.78% |
| San Diego-Chula Vista-Carlsbad, CA |
33.72% |
| San Jose-San Francisco-Oakland, CA |
46.34% |
| Seattle-Tacoma, WA |
31.57% |
| Spokane-Spokane Valley-Coeur d'Alene, WA-ID |
17.67% |
| St. Louis-St. Charles-Farmington, MO-IL |
20.03% |
| Tucson-Nogales, AZ |
19.28% |
| Virginia Beach-Norfolk, VA-NC |
18.80% |
| Washington-Baltimore-Arlington, DC-MD-VA-WV-PA |
33.94% |
| Note: The 2026 locality rate replaces the 2025 locality rate. It is not paid in addition to or on top of the 2025 locality rate. |